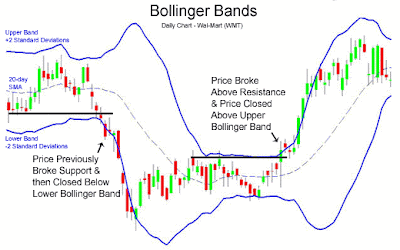
The chart of Wal-Mart (WMT) below shows two such Bollinger Band breakouts:
Bollinger Band Breakout through Resistance Buy Signal
Price breaks above the upper Bollinger Band after a period of price consolidation. Other confirming indicators are suggested, such as resistance being broken in the chart above of Wal-Mart stock.Bollinger Band Breakout through Support Sell Signal
Price breaks below the lower Bollinger Band. It is suggested that other confirming indicators be used, such as a support line being broken, such as in the example above of Wal-Mart stock breaking below support.This strategy is discussed by the man who created Bollinger Bands, John Bollinger.
Bollinger Bands can also be used to determine the direction and the strength of the trend. The chart below of the E-mini S&P 500 Futures contract shows a strong upward trend:
Bollinger Band Showing a Strong Trend
The chart above of the E-mini S&P 500 shows that during a strong uptrend, prices tend to stay in the upper half of the Bollinger Band, where the 20-period moving average (Bollinger Band centerline) acts as support for the price trend.The reverse would be true during a downtrend, where prices would be in the lower half of the Bollinger Band and the 20-period moving average would act as downward resistance.

