- Buy options with low volatility in hopes that volatility will increase and then sell back those options at a higher price.
- Sell options with high volatility in hopes that volatility will decrease and then buy back those same options at a cheaper price.
This blog want to give you today's forex prediction, or daily forex prediction, or daily forex forecasting. Use this prediction on your own risk. Also you get information about Forex Strategy, Forex Article, Technical Indicator, Technical Strategy, and many others Tutorial about Forex.
Tuesday, July 27, 2010
Technical Indicators - Option Volatility Strategies
There are two basic ways to trade volatility:
Technical Indicators - Bollinger Band Breakouts
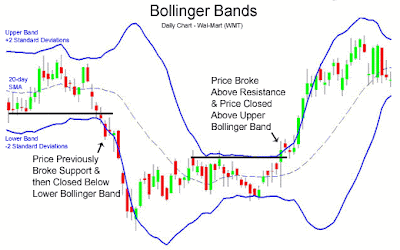
Basically the opposite of "Playing the Bands" and betting on reversion to the mean is playing Bollinger Band breakouts. Breakouts occur after a period of consolidation, when price closes outside of the Bollinger Bands. Other indicators such as support and resistance lines can prove beneficial when deciding whether or not to buy or sell in the direction of the breakout.
The chart of Wal-Mart (WMT) below shows two such Bollinger Band breakouts:
The chart of Wal-Mart (WMT) below shows two such Bollinger Band breakouts:
Subscribe to:
Posts (Atom)

