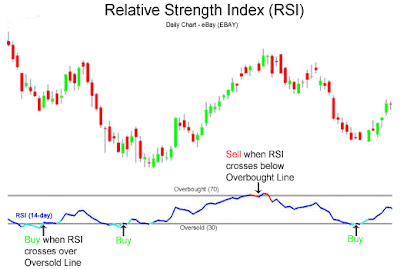
- Generate buy and sell signals
- Show overbought and oversold conditions
- Confirm price movement
- Warn of potential price reversals through divergences
This blog want to give you today's forex prediction, or daily forex prediction, or daily forex forecasting. Use this prediction on your own risk. Also you get information about Forex Strategy, Forex Article, Technical Indicator, Technical Strategy, and many others Tutorial about Forex.
Thursday, July 29, 2010
Technical Indicators - Relative Strength Index (RSI)
One of the most popular technical analysis indicators, the Relative Strength Index (RSI) is an oscillator that measures current price strength in relation to previous prices. The RSI is a versatile tool, it can be used to:
Technical Indicators - RSI Alternative Buy and Sell Signals and Divergences
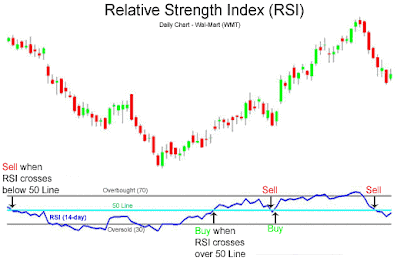
An alternative way that the Relative Strength Index (RSI) gives buy and sell signals is given below:
- Buy when price and the Relative Strength Index are both rising and the RSI crosses above the 50 Line.
- Sell when the price and the RSI are both falling and the RSI crosses below the 50 Line.
Today's Forex Prediction - July 29, 2010
| PAIR | TODAY'S PREDICTION | |
| MAX | MIN | |
| EUR/USD | 1.3090 | 1.2946 |
See : How To Applying My Prediction
Yesterday Prediction Rate : ACCURATE (Average Error < 50pips)
Subscribe to:
Comments (Atom)

