- The current price minus the price n-periods ago
Showing posts with label Technical Strategy. Show all posts
Showing posts with label Technical Strategy. Show all posts
Saturday, July 31, 2010
Technical Indicators - Momentum
The Momentum indicator compares where the current price is in relation to where the price was in the past. How far in the past the comparison is made is up to the technical analysis trader. The calculation of Momentum is quite simple (n is the number of periods the technical trader selects):
Technical Indicators - Momentum Divergences
Identifying divergences between price and technical indicators is important aspect of technical analysis trading. Bullish divergences can signal a trader to exit their short position; similarly, bearish divergences warn that prices could correct and it is advisable to exit any longs.
In the chart below of the S&P 500 exchange traded fund (SPY), Momentum divergences can be seen:

In the chart below of the S&P 500 exchange traded fund (SPY), Momentum divergences can be seen:

Technical Indicators - Momentum, Buy and Sell Signals
An example of the Momentum indicator is shown below in the chart of the E-mini Nasdaq 100 Future:

Potential buy or shortsell entries are shown above in the chart.

Potential buy or shortsell entries are shown above in the chart.
Thursday, July 29, 2010
Technical Indicators - Relative Strength Index (RSI)
One of the most popular technical analysis indicators, the Relative Strength Index (RSI) is an oscillator that measures current price strength in relation to previous prices. The RSI is a versatile tool, it can be used to:
- Generate buy and sell signals
- Show overbought and oversold conditions
- Confirm price movement
- Warn of potential price reversals through divergences
Technical Indicators - RSI Alternative Buy and Sell Signals and Divergences
An alternative way that the Relative Strength Index (RSI) gives buy and sell signals is given below:
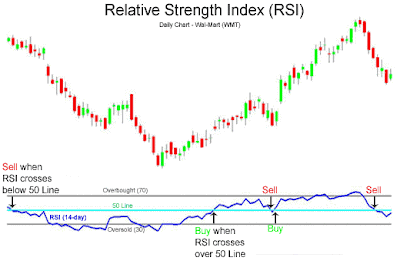
- Buy when price and the Relative Strength Index are both rising and the RSI crosses above the 50 Line.
- Sell when the price and the RSI are both falling and the RSI crosses below the 50 Line.

Technical Indicators - RSI Buy and Sell Signals
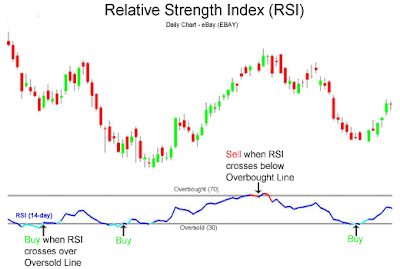
The chart below of eBay (EBAY) shows how the RSI can generate easy to follow buy and sell signals:

Wednesday, July 28, 2010
Technical Indicators - Pivot Points
Pivot Points are used to project potential support and resistance levels. The main time periods used are daily, weekly, and monthly pivots. The formula for the daily pivot point, support, and resistance is shown below:

- Pivot Point = [Yesterday's High + Yesterday's Low + Yesterday's Close] / 3

Technical Indicators - Pivot Point Trade Examples
In addition to giving buy and sell signals, pivot points give traders a good time to get out of their trade. To illustrate, during a rally some traders will set their sell orders right below the next resistance line. Thus, pivot point resistance and support lines can generate ready made profit targets.
A 5-minute chart of the Nasdaq 100 ETF (QQQQ) is shown next:

A 5-minute chart of the Nasdaq 100 ETF (QQQQ) is shown next:

Technical Indicators - Pivot Points, Support, and Resistance
Pivot Point = [Yesterday's High + Yesterday's Low + Yesterday's Close] / 3 A 15-minute chart of the mini-Dow futures contract and the corresponding floor trader pivots are shown below:


Tuesday, July 27, 2010
Technical Indicators - Bollinger Bands
Bollinger Bands is a versatile tool combining moving averages and standard deviations and is one of the most popular technical analysis tools available for traders. There are three components to the Bollinger Band indicator:

There are three main methodologies for using Bollinger Bands, discussed in the following sections:
- Moving Average: By default, a 20-period simple moving average is used.
- Upper Band: The upper band is usually 2 standard deviations (calculated from 20-periods of closing data) above the moving average.
- Lower Band: The lower band is usually 2 standard deviations below the moving average.

There are three main methodologies for using Bollinger Bands, discussed in the following sections:
Technical Indicators - Option Volatility Strategies
There are two basic ways to trade volatility:

- Buy options with low volatility in hopes that volatility will increase and then sell back those options at a higher price.
- Sell options with high volatility in hopes that volatility will decrease and then buy back those same options at a cheaper price.

Technical Indicators - Bollinger Band Breakouts
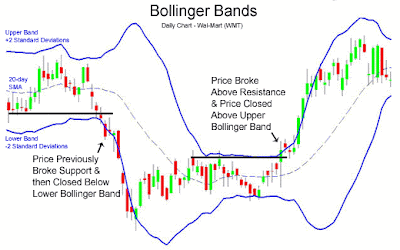
Basically the opposite of "Playing the Bands" and betting on reversion to the mean is playing Bollinger Band breakouts. Breakouts occur after a period of consolidation, when price closes outside of the Bollinger Bands. Other indicators such as support and resistance lines can prove beneficial when deciding whether or not to buy or sell in the direction of the breakout.
The chart of Wal-Mart (WMT) below shows two such Bollinger Band breakouts:
The chart of Wal-Mart (WMT) below shows two such Bollinger Band breakouts:

Technical Indicators - Playing the Bands
Playing the bands is based on the premise that the vast majority of all closing prices should be between the Bollinger Bands. That stated, then a stock's price going outside the Bollinger Bands, which occurs very rarely, should not last and should "revert back to the mean", which generally means the 20-period simple moving average. A version of this strategy is discussed in the book Trade Like a Hedge Fund by James Altucher.
Technical Indicators - Elliott Wave
Elliott Wave theory states that prices move in waves. These waves occur in a repeating pattern of a (1) move up, (2) then a partial retracement down, (3) another move up, (4) a retracement, (5) then finally a last move up. Then, there is a (A) full retracement, followed by a (B) partial retracement upward, then (C) a full move downward. This repeats on a macro and micro time frame. A visual illustration of the basic pattern of the Elliott Wave is given below. A real life example of Elliott Wave in action is given further down:


Monday, July 26, 2010
Technical Indicators - Fibonacci
Fibonacci tools utilize special ratios that naturally occur in nature to help predict points of support or resistance. Fibonacci numbers are 1, 1, 2, 3, 5, 8, 13, 21, 34, 55, 89, etc. The sequence occurs by adding the previous two numbers (i.e. 1+1=2, 2+3=5) The main ratio used is .618, this is found by dividing one Fibonacci number into the next in sequence Fibonacci number (55/89=0.618). The logic most often used by Fibonacci based traders is that since Fibonacci numbers occur in nature and the stock, futures, and currency markets are creations of nature - humans.
Technical Indicators - Fibonacci Time Extensions
Fibonacci Time Extensions are used to predict periods of price change (i.e. lows or highs). For example, after a downtrend, a reversal would be expected at a significant Fibonacci Time Extension line. Similarly, after an uptrend, a reversal warning could occur if a Fibonacci Time Extension was soon approaching.
The Fibonacci Time Extension tool is created by locating a significant high (low) and finding a significant retracement or extension low (high). The major Fibonacci ratios are then calculated and plotted by charting software.
The Fibonacci Time Extension tool is created by locating a significant high (low) and finding a significant retracement or extension low (high). The major Fibonacci ratios are then calculated and plotted by charting software.
Technical Indicators - Fibonacci Fans
Fibonacci Fans use Fibonacci ratios based on time and price to construct support and resistance trendlines; also, Fibonacci Fans are used to measure the speed of a trend's movement, higher or lower.
- If prices move below a Fibonacci Fan trendline, then price is usually expected to fall further until the next Fibonacci Fan trendline level; therefore, Fibonacci Fan trendlines are expected to serve as support for uptrending markets.
- Likewise, in a downtrend, if price rises to a Fibonacci Fan trendline, then that trendline is expected to act as resistance; if that price is pierced, then the next Fibonacci Fan trendline higher is expected to act as resistance.
Technical Indicators - Fibonacci Arcs
Fibonacci Arcs are percentage arcs based on the distance between major price highs and price lows. Therefore, with a major high, major low distance of 100 units, the 31.8% Fibonacci Arc would be a 31.8 unit semi-circle.
The chart below of the S&P 500 exchange traded fund (SPY) shows an example of a Fibonacci Arc:

The chart below of the S&P 500 exchange traded fund (SPY) shows an example of a Fibonacci Arc:

Technical Indicators - Fibonacci Retracement
Arguably the most heavily used Fibonacci tool is the Fibonacci Retracement. To calculate the Fibonacci Retracement levels, a significant low to a significant high should be found. From there, prices should retrace the initial difference (low to high or high to low) by a ratio of the Fibonacci sequence, generally the 23.6%, 38.2%, 50%, 61.8%, or the 76.4% retracement.
Subscribe to:
Posts (Atom)