Tuesday, July 27, 2010

Technical Indicators - Bollinger Bands

Bollinger Bands is a versatile tool combining moving averages and standard deviations and is one of the most popular technical analysis tools available for traders. There are three components to the Bollinger Band indicator:
  1. Moving Average: By default, a 20-period simple moving average is used.
  2. Upper Band: The upper band is usually 2 standard deviations (calculated from 20-periods of closing data) above the moving average.
  3. Lower Band: The lower band is usually 2 standard deviations below the moving average.
Bollinger Bands (in blue) are shown below in the chart of the E-mini S&P 500 Futures contract:


There are three main methodologies for using Bollinger Bands, discussed in the following sections:
  1. Playing the Bands
  2. Bollinger Band Breakouts
  3. Option Volatility Strategies

Technical Indicators - Option Volatility Strategies

There are two basic ways to trade volatility:
  1. Buy options with low volatility in hopes that volatility will increase and then sell back those options at a higher price.
  2. Sell options with high volatility in hopes that volatility will decrease and then buy back those same options at a cheaper price.
Since Bollinger Bands adapt to volatility, Bollinger Bands give options traders a good idea of when options are relatively expensive (high volatility) or when options are relatively cheap (low volatility). The chart below of Wal-Mart stock illustrates how Bollinger Bands can be used to trade volatility:


Technical Indicators - Bollinger Band Breakouts

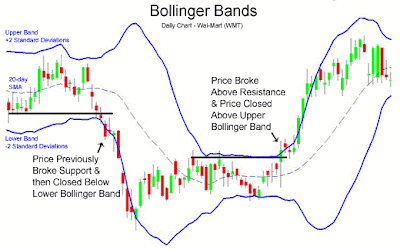
Basically the opposite of "Playing the Bands" and betting on reversion to the mean is playing Bollinger Band breakouts. Breakouts occur after a period of consolidation, when price closes outside of the Bollinger Bands. Other indicators such as support and resistance lines can prove beneficial when deciding whether or not to buy or sell in the direction of the breakout.
The chart of Wal-Mart (WMT) below shows two such Bollinger Band breakouts:


Technical Indicators - Playing the Bands

Playing the bands is based on the premise that the vast majority of all closing prices should be between the Bollinger Bands. That stated, then a stock's price going outside the Bollinger Bands, which occurs very rarely, should not last and should "revert back to the mean", which generally means the 20-period simple moving average. A version of this strategy is discussed in the book Trade Like a Hedge Fund by James Altucher.


Technical Indicators - Elliott Wave

Elliott Wave theory states that prices move in waves. These waves occur in a repeating pattern of a (1) move up, (2) then a partial retracement down, (3) another move up, (4) a retracement, (5) then finally a last move up. Then, there is a (A) full retracement, followed by a (B) partial retracement upward, then (C) a full move downward. This repeats on a macro and micro time frame. A visual illustration of the basic pattern of the Elliott Wave is given below. A real life example of Elliott Wave in action is given further down:


Today's Forex Prediction - July 27, 2010

PAIR TODAY'S PREDICTION
MAX MIN
EUR/USD 1.3069 1.2897

See : How To Applying My Prediction

Yesterday Prediction Rate : ACCURATE (Error < 50pips)