- The current price minus the price n-periods ago
Showing posts with label Buy Signal. Show all posts
Showing posts with label Buy Signal. Show all posts
Saturday, July 31, 2010
Technical Indicators - Momentum
The Momentum indicator compares where the current price is in relation to where the price was in the past. How far in the past the comparison is made is up to the technical analysis trader. The calculation of Momentum is quite simple (n is the number of periods the technical trader selects):
Technical Indicators - Momentum Divergences
Identifying divergences between price and technical indicators is important aspect of technical analysis trading. Bullish divergences can signal a trader to exit their short position; similarly, bearish divergences warn that prices could correct and it is advisable to exit any longs.
In the chart below of the S&P 500 exchange traded fund (SPY), Momentum divergences can be seen:

In the chart below of the S&P 500 exchange traded fund (SPY), Momentum divergences can be seen:

Technical Indicators - Momentum, Buy and Sell Signals
An example of the Momentum indicator is shown below in the chart of the E-mini Nasdaq 100 Future:

Potential buy or shortsell entries are shown above in the chart.

Potential buy or shortsell entries are shown above in the chart.
Thursday, July 29, 2010
Technical Indicators - RSI Alternative Buy and Sell Signals and Divergences
An alternative way that the Relative Strength Index (RSI) gives buy and sell signals is given below:
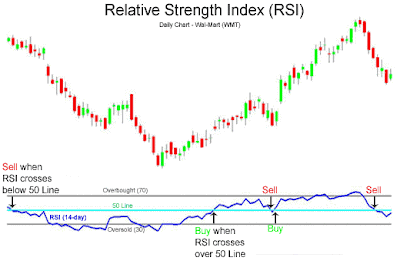
- Buy when price and the Relative Strength Index are both rising and the RSI crosses above the 50 Line.
- Sell when the price and the RSI are both falling and the RSI crosses below the 50 Line.

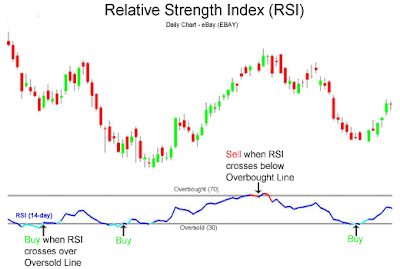
Technical Indicators - RSI Buy and Sell Signals
The chart below of eBay (EBAY) shows how the RSI can generate easy to follow buy and sell signals:

Subscribe to:
Posts (Atom)